What you see
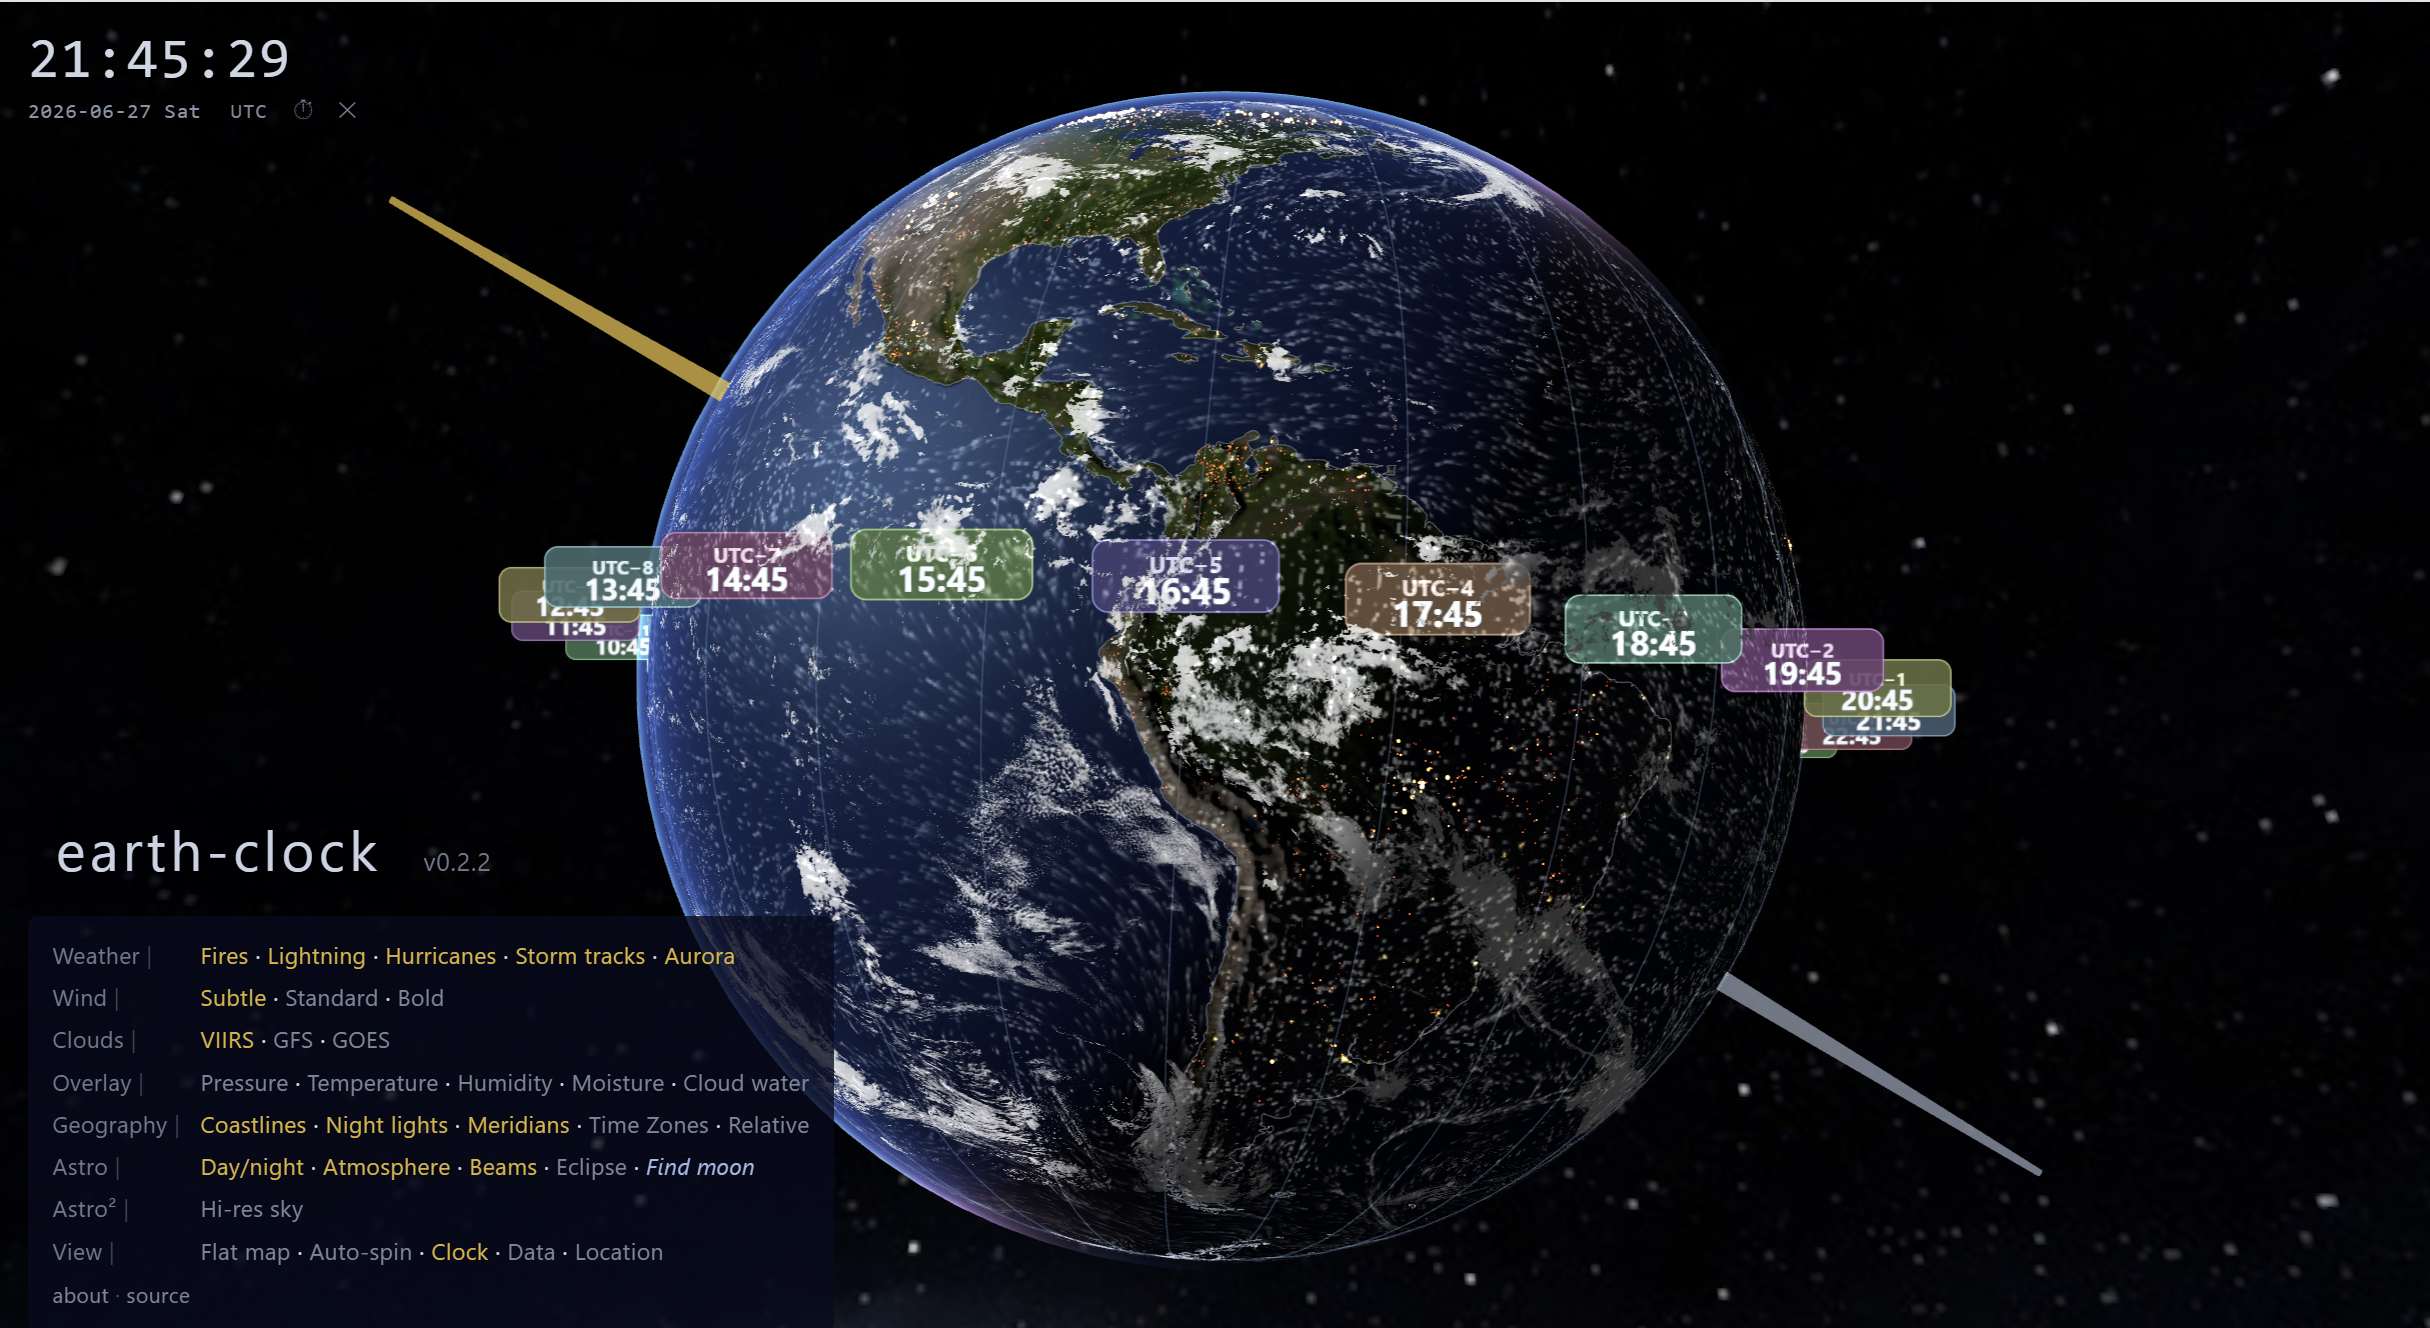
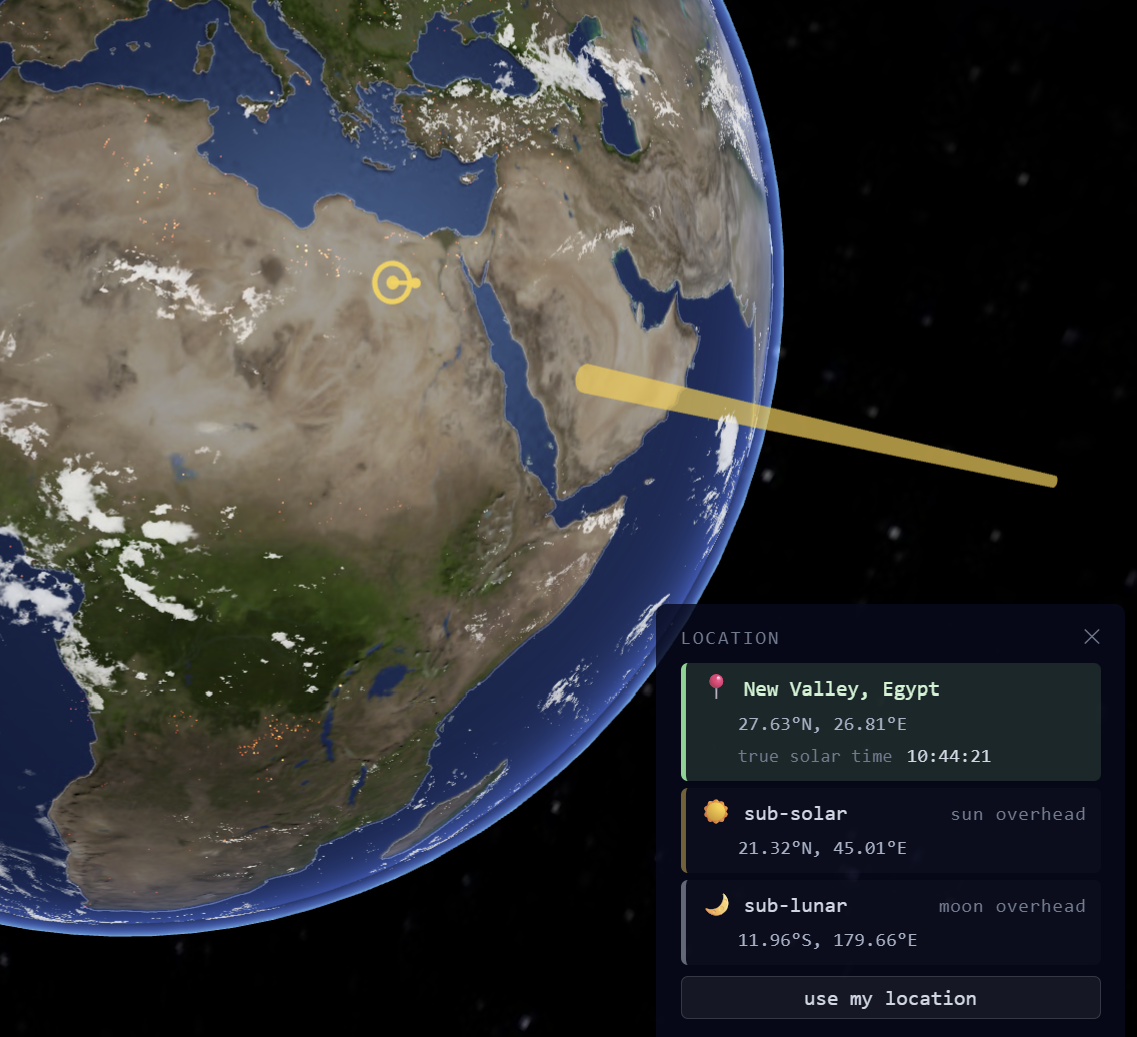
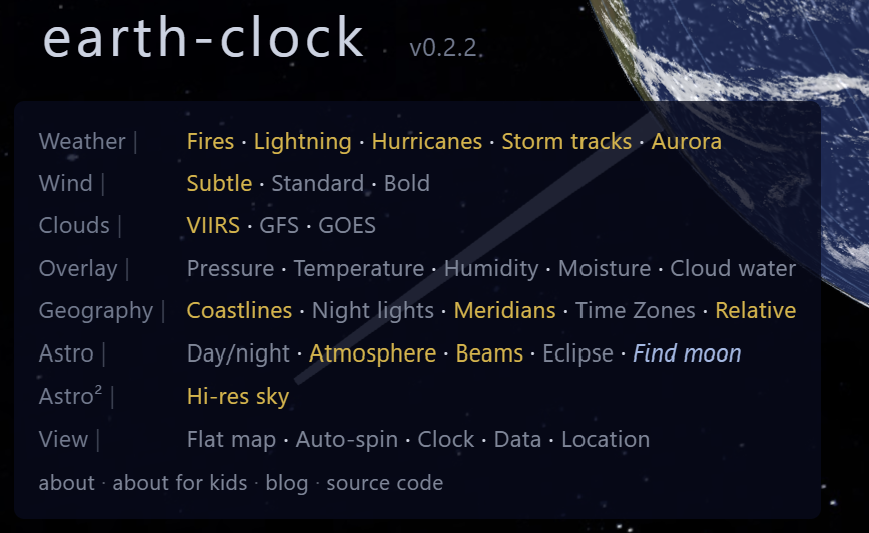
Most globes are stylised diagrams. This one is trying to be accurate. The texture is a real daily satellite composite. The clouds are from yesterday's VIIRS pass. The day/night boundary is where it actually is at this second — not a painted-on approximation. The gold arm pointing away from the globe shows you exactly where the sun is in 3D space; follow it and you'd reach the sun. The silver arm does the same for the moon. A thin cyan rod through the poles is Earth's spin axis, and two rings around the globe mark the equator and the path the sun takes across the year — see Axis, equator and ecliptic.
The day/night terminator
The sun's position is computed from your computer's clock via a sub-degree-accurate solar ephemeris — right ascension, declination, and the resulting terminator on Earth's surface all follow directly. If the lit hemisphere is centred over the Indian Ocean, the sun really is overhead in the Indian Ocean right now.
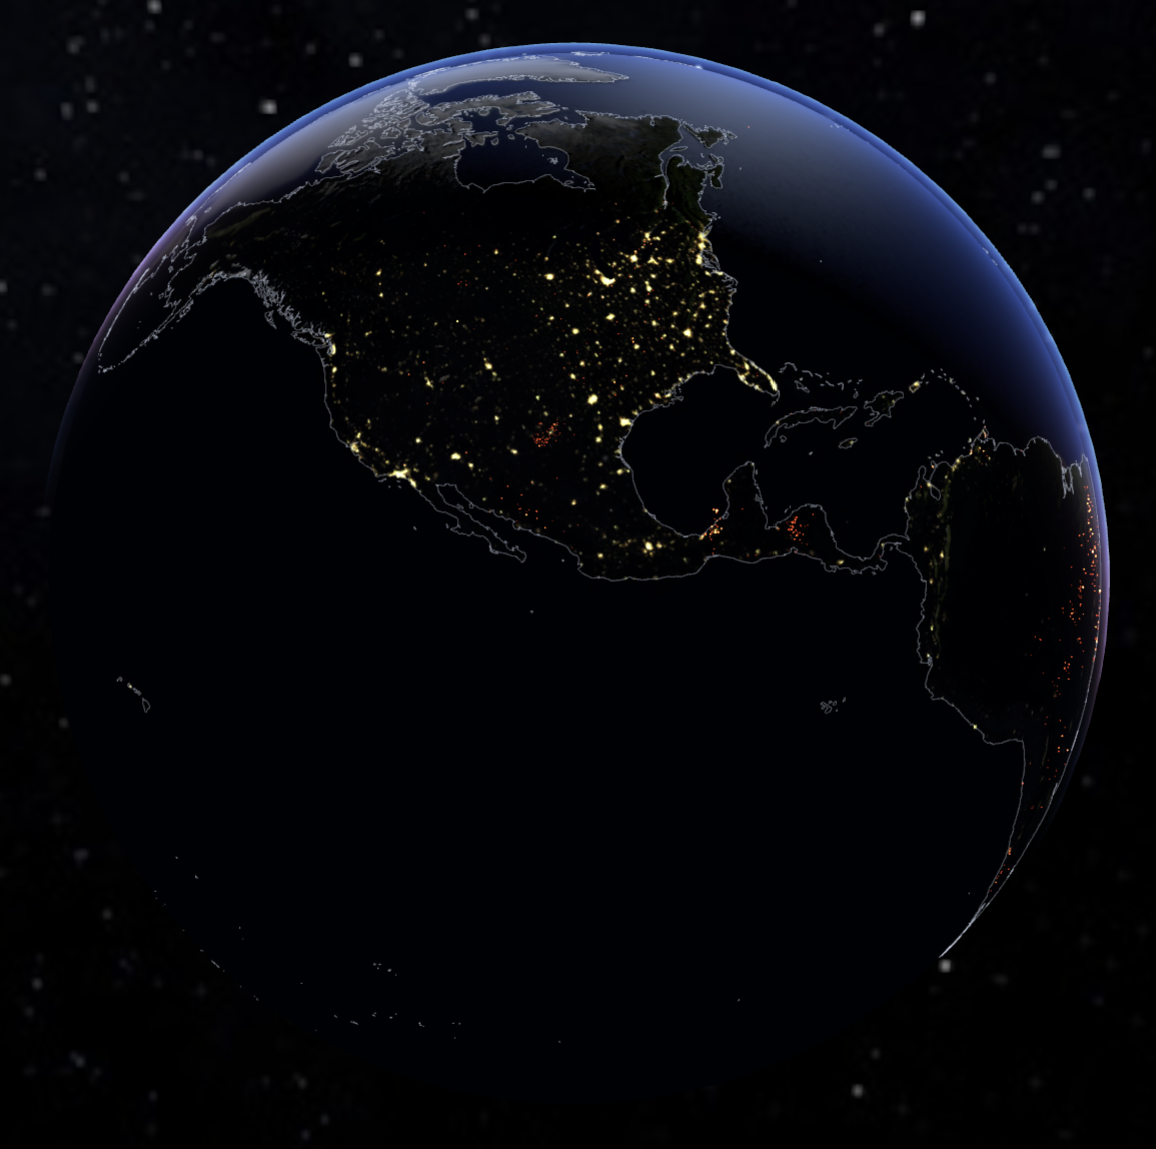
The night side
The moon
The moon is placed at its true geocentric position — 56 to 63 Earth radii away, phase consistent with the sun–Earth–moon geometry as you'd see it tonight. It's lit by the same directional light that lights Earth, so the phase emerges naturally from geometry rather than being painted on.
The stars
A real photographic star map (Solar System Scope, derived from deep-sky imagery) wraps the scene at the far horizon. The Milky Way band is in approximately the right celestial orientation.
Geography & time zones
The Geography row in the menu covers the coastline overlay and a time-zone overlay that ships in three modes: Meridians, Time Zones, and Relative.
Meridians
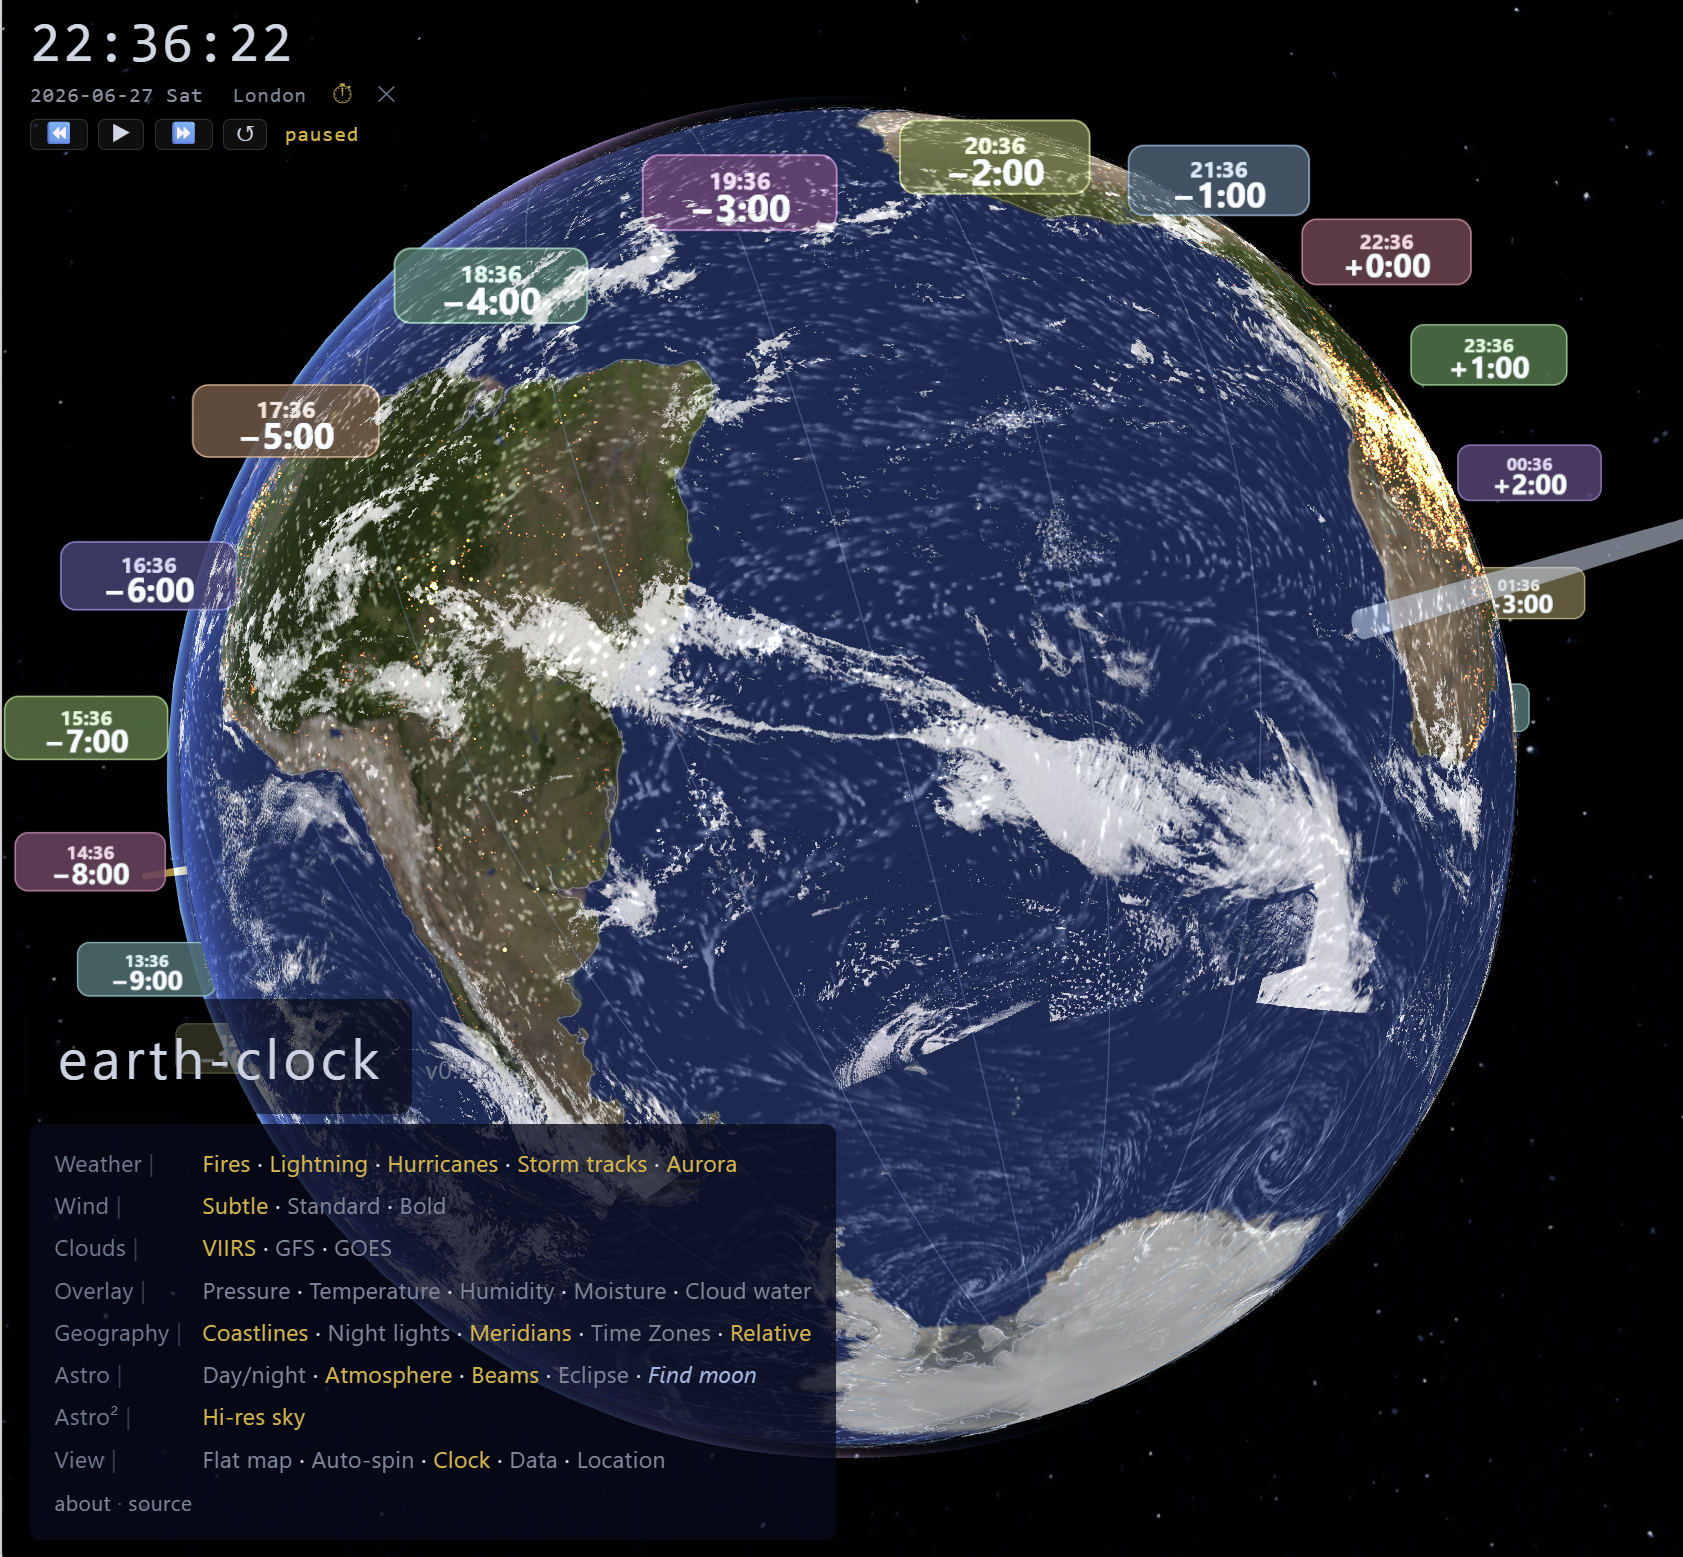
Twenty-four lines at the centres of each nominal UTC hour band — 0° (prime meridian), ±15°, ±30° … ±165°, and the antimeridian at ±180°. These are the lines dividing the world the way a simple geometry would: one hour = 15°, no exceptions. Each is labelled with the current local time and UTC offset.
Time Zones — political boundaries
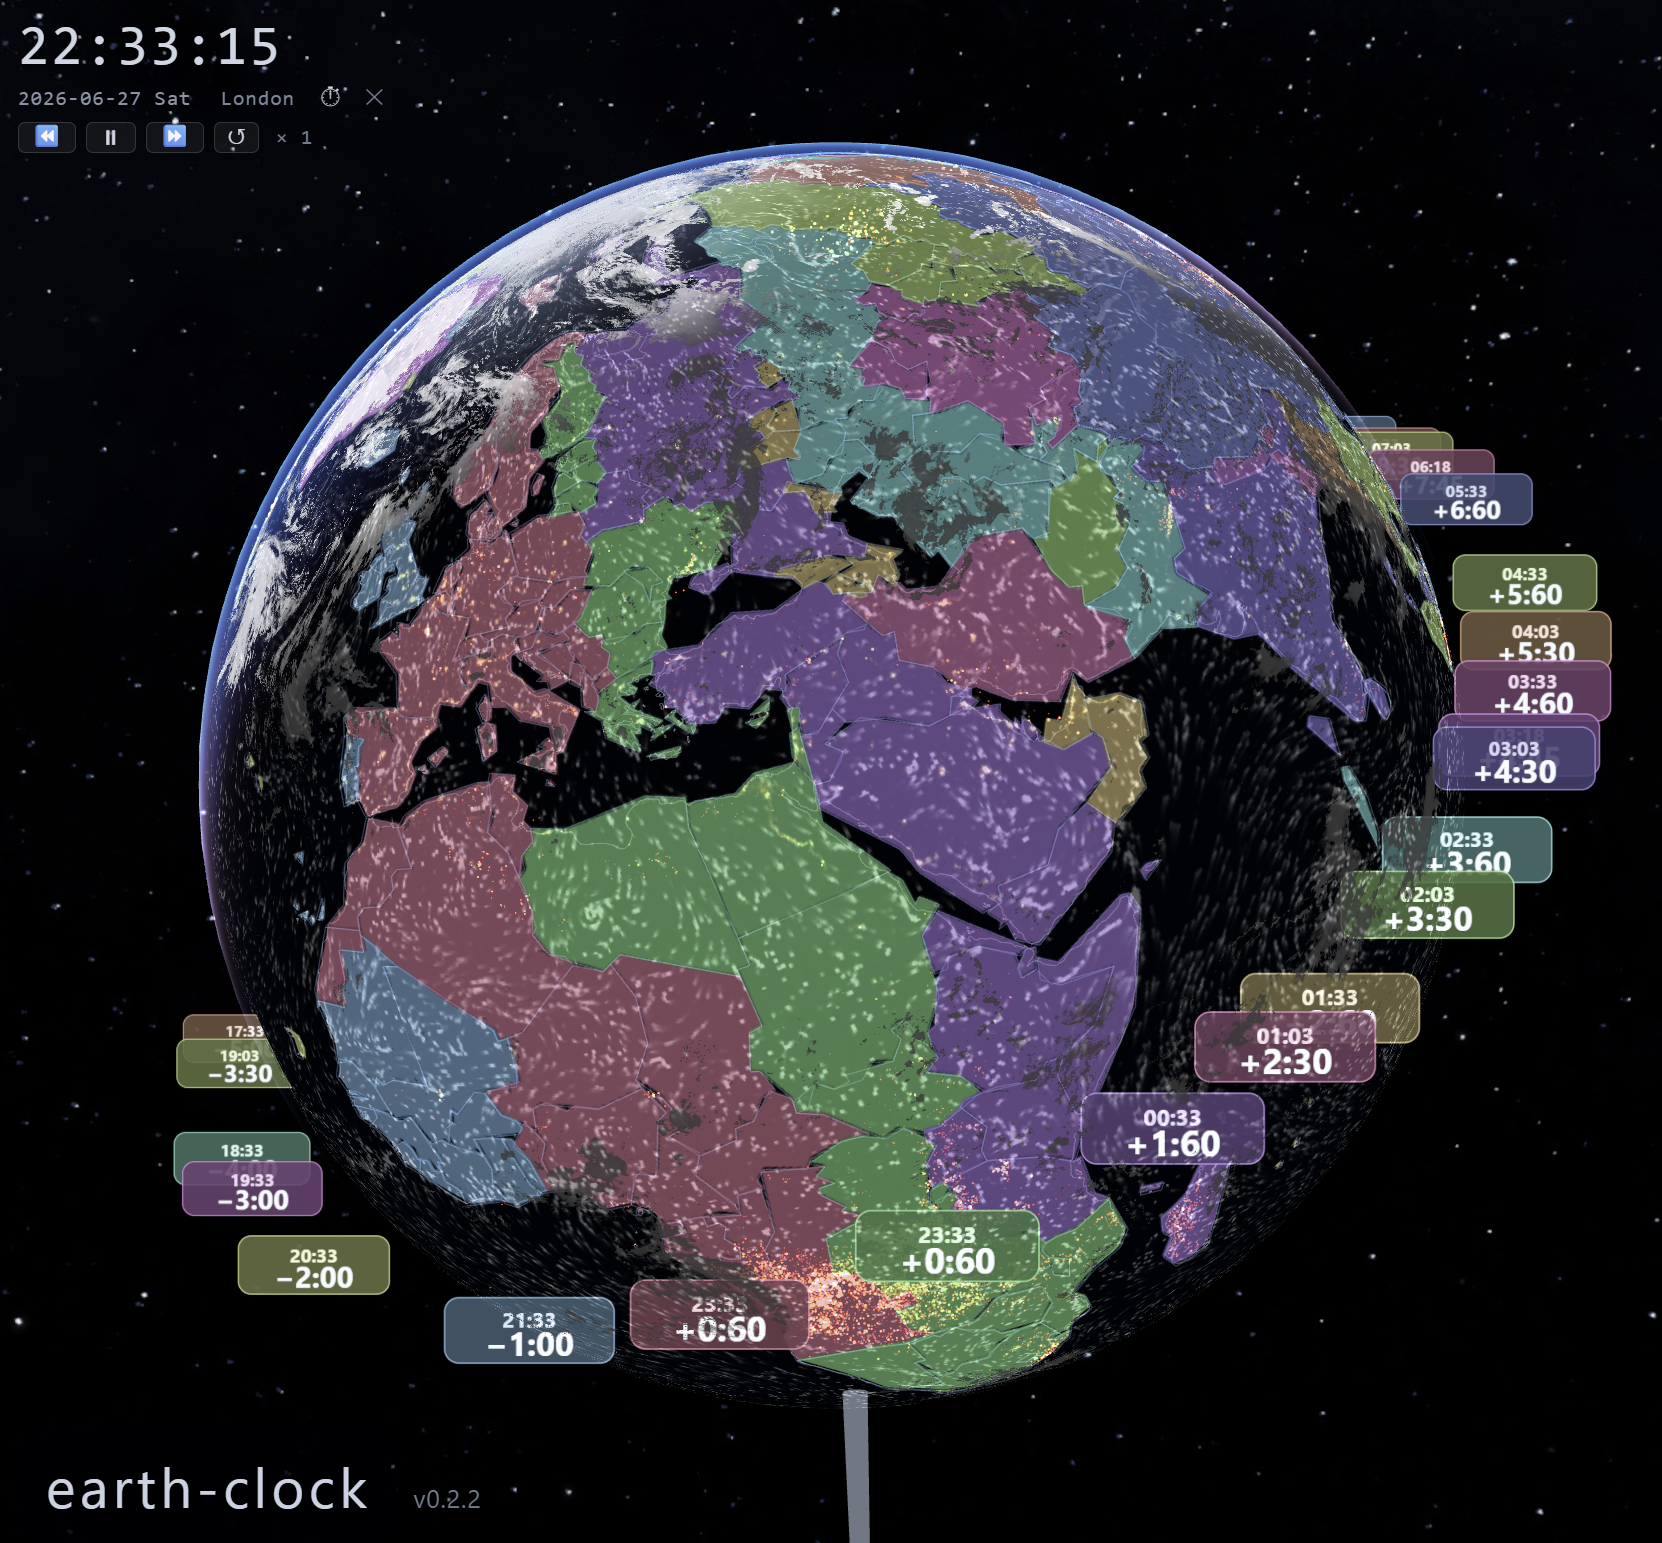
Real IANA timezone polygon boundaries from the timezone-boundary-builder project (2026b release, derived from OpenStreetMap). The raw data covers 364 named IANA zones; on the globe these reduce to 31 unique UTC offsets for labelling — one floating pill per offset, placed at the centroid of the geographically most representative zone for that offset (closest to the ideal longitude of offset × 15°). Boundaries are simplified at 0.4° RDP tolerance (~44 km at the equator) to keep the file compact without losing the political shape.
Labels are DST-aware: each pill uses Intl.DateTimeFormat with the representative zone's IANA name to derive the current effective offset — so UTC+1 (Central European Time) automatically reads UTC+2 during European summer, with no hardcoded transition dates.
The colour scheme — golden-angle hue rotation
Zone fills use a golden-angle hue rotation. The golden angle (~137.508°) is the same irrational angle that governs sunflower-seed packing — chosen because it distributes points most evenly around a circle without repeating. Applied to UTC offsets it means successive zones get hues spaced ~137° apart around the colour wheel, rather than the ~14° spacing a linear rainbow gives. Adjacent UTC bands end up looking obviously distinct; no two neighbouring zones share a similar colour even if their offsets differ by only 30 minutes.
The floating label pills use the same hue as the zone fill they represent — a teal pill corresponds to a teal band on the globe, a purple pill to a purple band — so the colour functions as a legend without needing a separate key.
Relative mode
Toggle Relative to label zones by their offset from your local clock rather than UTC. If you are in UTC+1, the UTC+3 zone shows +2:00 and UTC−5 shows −6:00. The time shown inside the pill switches to the actual local clock time for that zone. Useful for reading off scheduling differences at a glance.
Geology
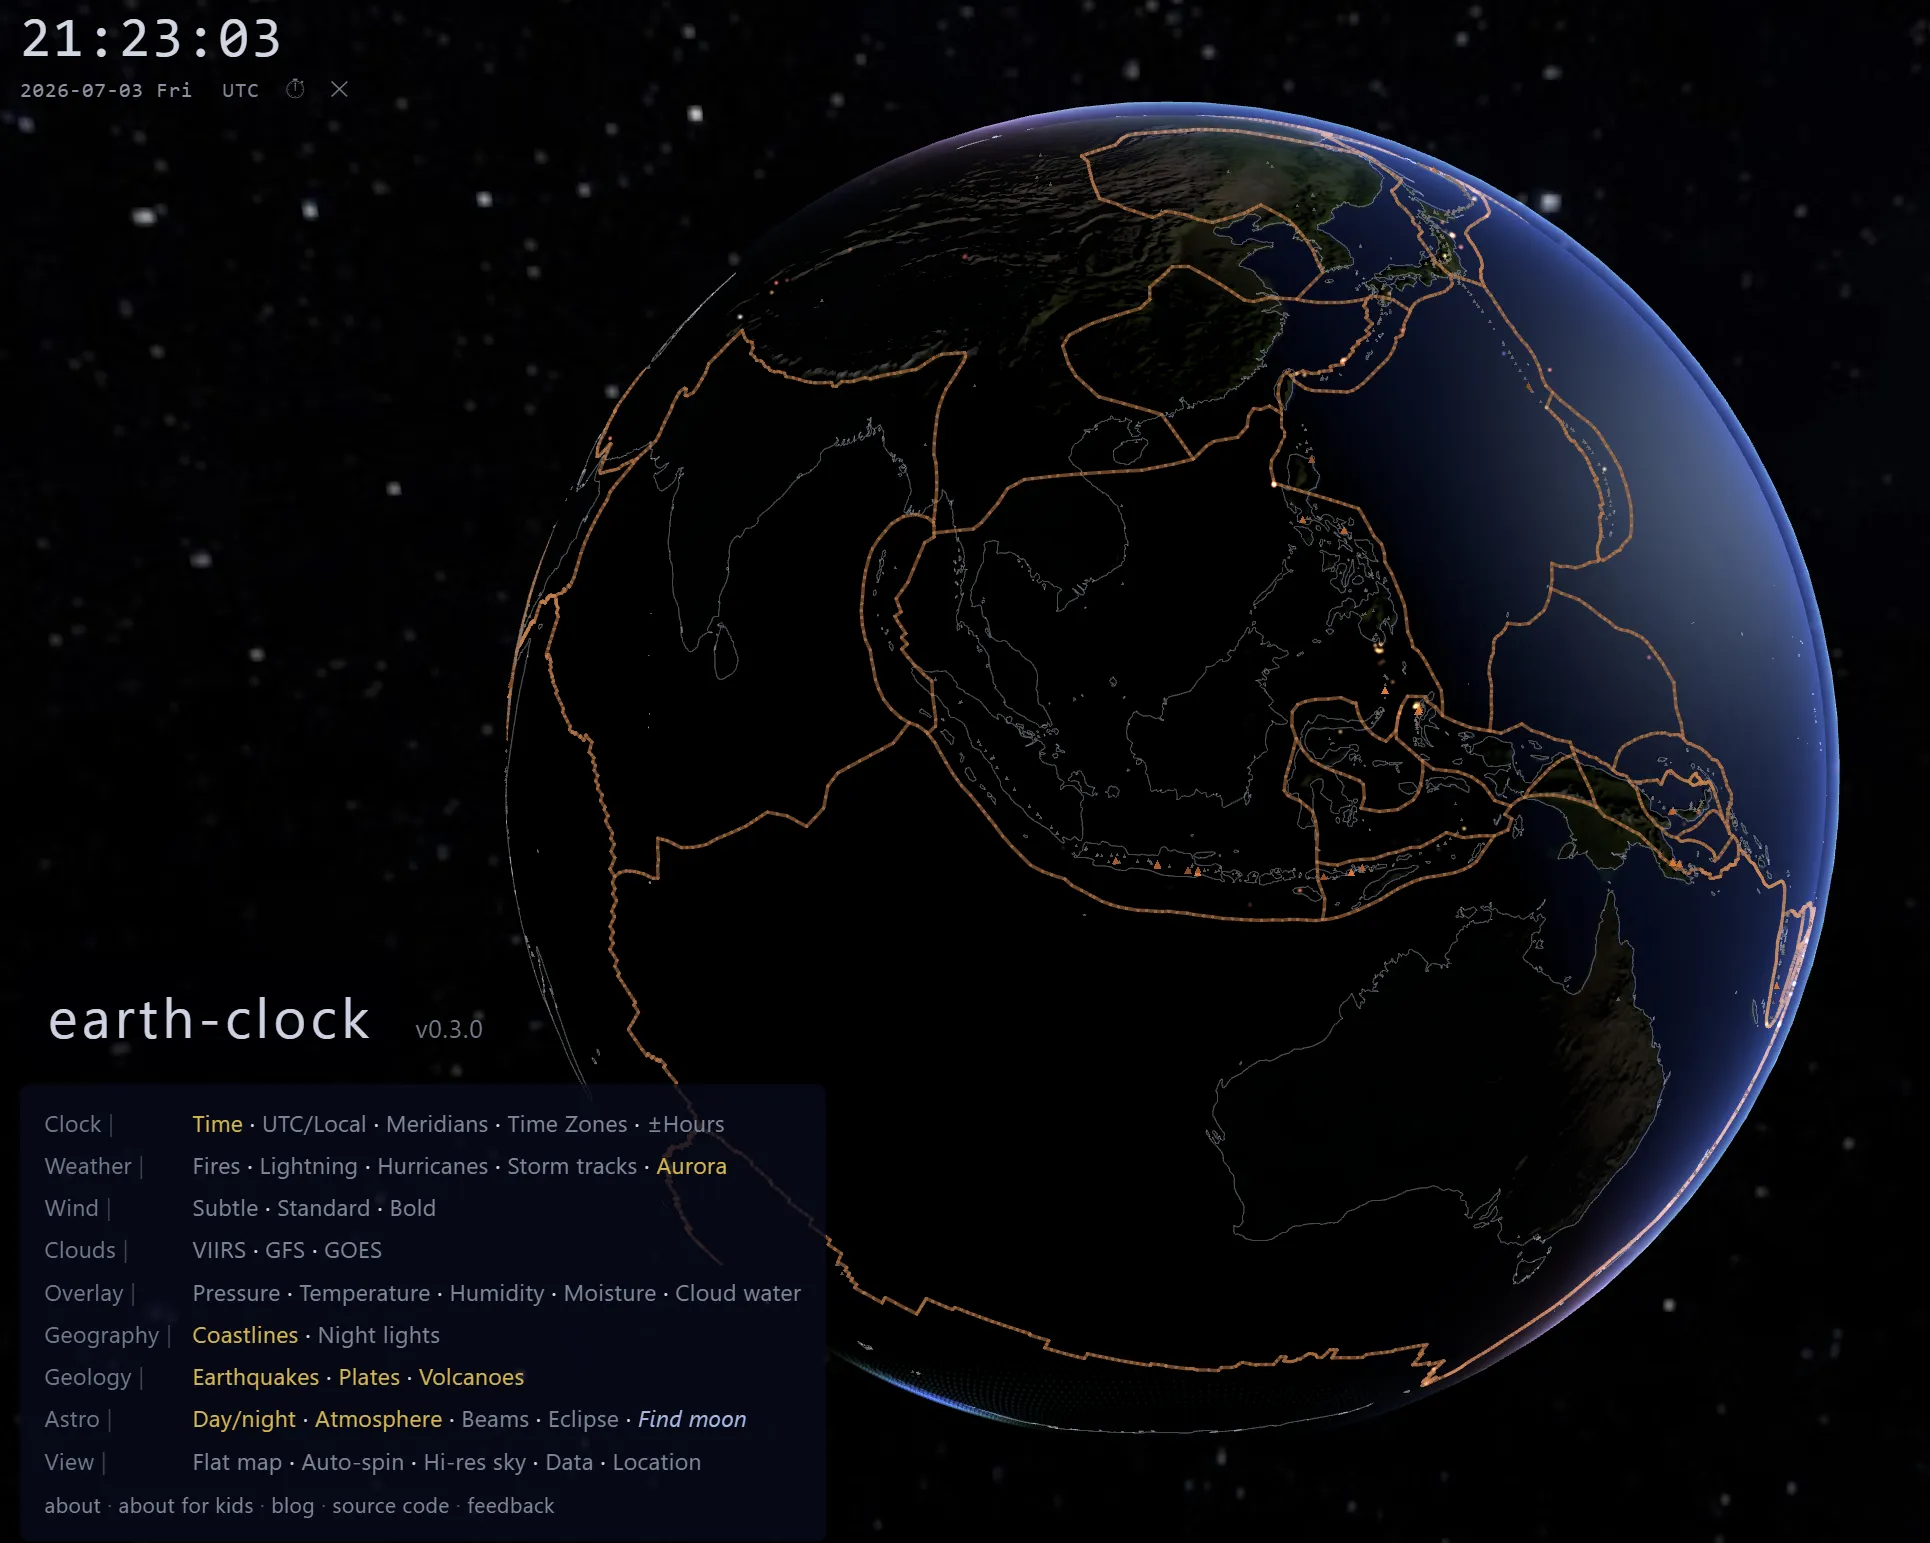
Added in v0.3.0, prompted by a primary-school class visit: kids instinctively want to see the structure of Earth, not just its weather. Tectonic plates, earthquakes, and volcanoes are deeply connected — most volcanoes and the overwhelming majority of earthquakes sit directly on plate boundaries — so all three live together in one Geology row in the menu, between Geography and Astro.
Tectonic plates
241 plate-boundary lines from Peter Bird's PB2002 model, drawn in warm amber/terracotta so they read distinctly from the cool-white coastlines. Effectively static on human timescales, so the data is bundled once rather than fetched live. Rendered with Three.js's "fat line" material rather than the default WebGL line — plain LineBasicMaterial.linewidth is silently capped at 1px on almost every desktop GPU driver, so a genuinely thicker stroke needs a purpose-built shader.
Source: Peter Bird (2003), An updated digital model of plate boundaries, mirrored as GeoJSON by fraxen/tectonicplates.
Earthquakes
Every earthquake from the past 7 days, worldwide. Marker size scales with magnitude; colour encodes depth — shallow crustal quakes read red, deep subduction-zone events read blue. Events fade smoothly to nothing across the 7-day window, with a brief settling pulse on anything under a day old.
Source: USGS Earthquake Hazards Program, refreshed every 15 min via a small server-side proxy (USGS doesn't send CORS headers, so the browser can't fetch it directly) · earthquake.usgs.gov
Volcanoes & active eruptions
1,215 Holocene-era volcanoes from the Smithsonian's Global Volcanism Program, each a small triangular marker. Most sit quietly; any volcano within 20 km of a current NASA FIRMS thermal-anomaly detection — the same feed that drives the Active fires layer below — flips to a hot, pulsing colour. A live, approximate "this one's currently active" signal with no extra data feed of its own.
Source: Smithsonian Institution, Global Volcanism Program · volcano.si.edu
Where the live data comes from
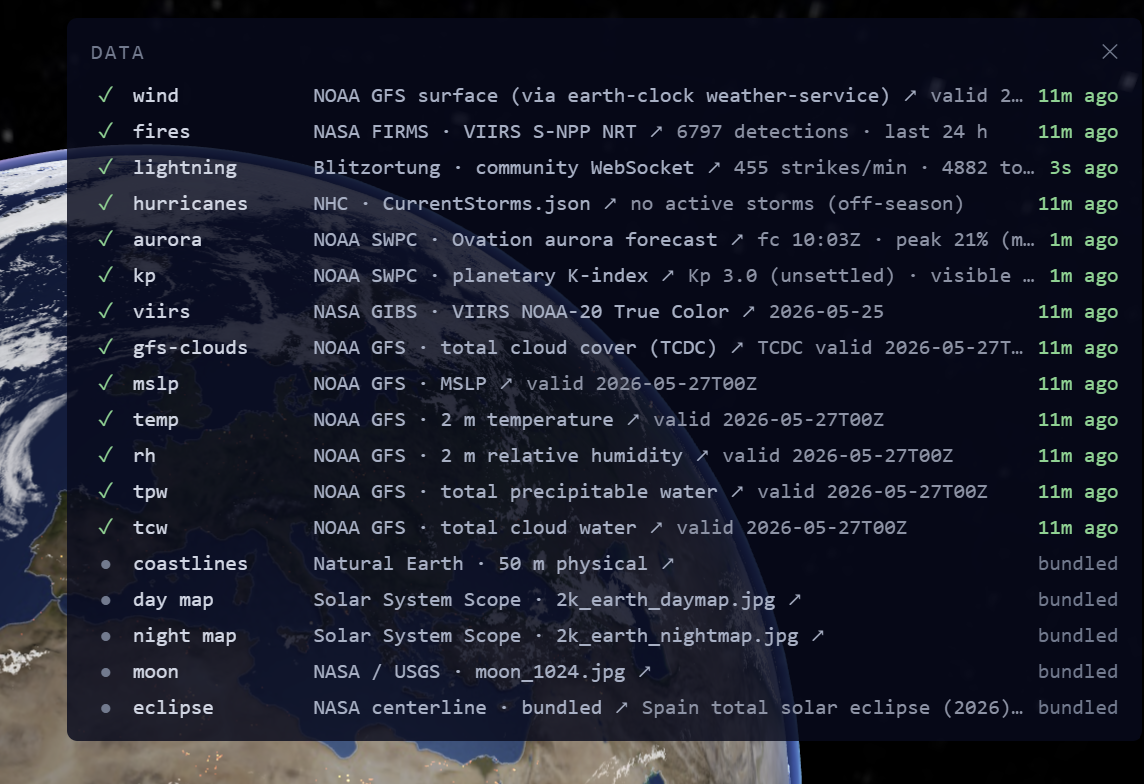
Almost everything moving on the globe is fetched directly from public-domain scientific data feeds. Click any source name in the in-app Data panel to open the originating organisation's overview page.
-
Clouds refreshed daily
VIIRS NOAA-20 daily true-color global mosaic. Stitched from 50 tiles of the 250 m TileMatrixSet at zoom 3 into a 5120 × 2560 equirectangular texture.
Source: NASA GIBS · gibs.earthdata.nasa.gov
-
Wind refreshed every 6 h
GFS surface wind (10 m above ground, U and V components). 65 536 GPU-simulated particles trace the actual flow, anti-aliased into world-space accumulator buffers for the streamline effect.
Source: NOAA NOMADS · nomads.ncep.noaa.gov
-
Pressure, temperature, humidity, moisture, cloud water refreshed every 6 h
GFS mean sea-level pressure (MSLP), 2 m air temperature, 2 m relative humidity, total precipitable water (TPW), and total cloud water (TCW). Switchable as a single mutex-row overlay; each rendered as a coloured shell at radius 1.006 R⊕. GFS's own sea-level pressure field uses a packing our decoder can't read, so the MSLP overlay takes surface pressure and reduces it to sea level with the barometric formula (surface height + 2 m temperature) — without that step mountains and ice sheets showed up as permanent "lows".
Source: NOAA NOMADS GFS
-
Aurora refreshed every 5 min
Ovation aurora oval probability over both polar regions — ~65 000 grid points coloured by probability, rendered on the night side only (a real aurora is invisible against bright daylight).
Source: NOAA SWPC · swpc.noaa.gov
-
Kp index refreshed every 5 min
Planetary K-index, the standard 0–9 scale of geomagnetic disturbance. Drives a plain-language "quiet / unsettled / active / minor storm / …" label on the in-app Data panel, and scales the aurora layer's brightness: Kp 3 is neutral, quiet nights dim to 0.7×, storms brighten up to 1.4×.
Source: NOAA SWPC · swpc.noaa.gov
-
Active fires refreshed hourly
VIIRS S-NPP near-real-time fire detections over the past 24 h, worldwide. Each pin sized by fire-radiative-power (FRP); colour ramps from deep red (small) to white-yellow (intense). Flicker frequency proportional to brightness.
Source: NASA FIRMS · firms.modaps.eosdis.nasa.gov
-
Tropical cyclones refreshed every 15 min
All currently-active tropical cyclones worldwide. Each storm rendered as a pulsing spiral sprite (eye + arms + outer ring) sized and coloured by Saffir–Simpson intensity (TD → TS → Cat 1-5). Past-track and 5-day forecast lines plus cone-of-uncertainty polygons from per-storm KMZ feeds.
Source: NOAA NHC · nhc.noaa.gov
-
Lightning live stream
Real-time lightning strikes from the worldwide Blitzortung community network — typically ~200 ms after each detected stroke. Renders as a brief additive flash that fades over ~0.6 s. The Data panel shows a rolling 60-second strike rate.
Source: Blitzortung · blitzortung.org — a community of volunteer-operated VLF receiving stations
-
Eclipses bundled (4 catalogued events)
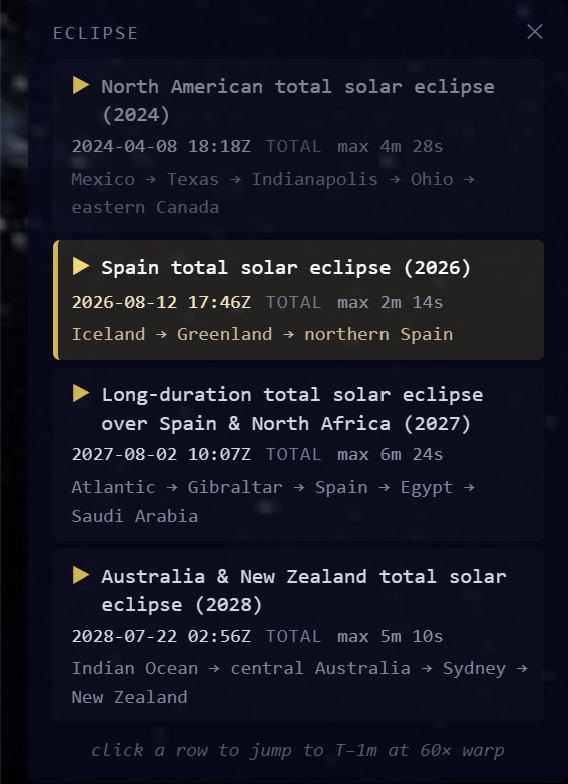
Path of totality + live umbra disc for catalogued solar eclipses, derived directly from NASA Goddard's Espenak/Meeus predictions. Currently bundled: 2024-04-08 (North America, historical), 2026-08-12 (Spain — the headline event), 2027-08-02 (Egypt — the long one), and 2028-07-22 (Australia & New Zealand, including totality directly over Sydney). Open the in-app Eclipse panel to jump to any event.
Source: NASA GSFC · eclipse.gsfc.nasa.gov
-
Space stations refreshed every 4 h
Orbital elements (GP / OMM) for the ISS, Tiangong and their visiting vehicles, mirrored by a small server-side service so browsers never hit CelesTrak directly. Positions are computed in the browser with SGP4. See People in orbit.
Source: CelesTrak · celestrak.org
-
Coastlines bundled
Natural Earth 50 m coastlines, encoded as TopoJSON and rendered as line segments rotating with Earth.
Source: naturalearthdata.com (public domain)
The astronomy
Sub-solar point
The sub-solar point is the place on Earth where the sun is currently directly overhead. It moves westward at 15° per hour as Earth rotates underneath. Its latitude varies between +23.44° (June solstice) and −23.44° (December solstice) as Earth's tilted axis precesses against the ecliptic plane.
Computed from a low-precision (~0.01° accuracy) solar ephemeris using mean longitude, mean anomaly, and the obliquity of the ecliptic. The same formula drives day-of-year lighting in every Earth visualisation since cambecc/earth.
Axis, equator and ecliptic
With Beams on, three reference marks sit alongside the sun and moon arms:
- The spin axis — a narrow cyan rod through the true geographic poles, labelled N and S. The ring with an arrowhead just below N shows which way Earth turns: counter-clockwise seen from above the North Pole, carrying every place west → east, which is why the sun rises in the east. The axis never moves on screen — it points at the same spot among the stars (near Polaris) all year, and it's the globe that turns around it.
- The equator — the cyan ring around the middle, at right angles to the axis.
- The ecliptic — the gold ring: the plane of Earth's orbit, and so the great circle the sub-solar point traces over a year. The gold sun arm always meets the globe on this ring.
The 23.44° between the two rings is Earth's obliquity, and it is the whole story of the seasons. Where the gold ring crosses the cyan one are the equinoxes (March and September); its furthest points north and south of the equator are the solstices, touching the Tropics of Cancer and Capricorn. Leave Beams on and time-warp through a few months to watch the sun arm slide along the ecliptic.
Implementation note: all three live in the same tilted equatorial frame as the globe (a 23.44° rotation about the scene's Z axis), with the ecliptic pole at (0, cos ε, sin ε) in the scene's J2000 equatorial axes — the same frame the solar ephemeris uses, so the sun arm and the gold ring agree by construction.
Greenwich mean sidereal time
The angle Earth has rotated past the J2000 epoch reference point, after correcting for precession of the equinoxes. This is the conversion factor between the inertial celestial frame (where stars sit at fixed positions) and Earth's geographic frame (where Greenwich is at longitude 0°). Everything that has to stay "glued to the ground" — coastlines, weather overlays, fire detections, hurricane tracks — applies a daily rotation by GMST.
Moon
The moon's position uses Meeus's truncated ELP-2000-82B series (60+ perturbation terms across longitude, latitude and distance), giving ~10 arcsec angular accuracy and ~10 km in distance. That's about 100× better than the simpler Schlyter formulae we used through v0.1.5, and crucially smaller than the sun's apparent disc — so observer-relative eclipse geometry now lands correctly anywhere on the planet at any moment. (Earlier versions had to rely on bundled NASA centerline waypoints for the headline eclipses because the runtime calculation wasn't accurate enough at totality. From v0.1.6 onward the runtime calculation is good enough on its own; the catalogued waypoints stay around as a deterministic fallback for the four headline events.)
Reference: Jean Meeus, Astronomical Algorithms (2nd ed., 1998), chapter 47.
People in orbit
Added in v0.5.0. Right now there are people living about 400 km above the globe you're looking at — on the International Space Station (pale blue marker) and on China's Tiangong station (coral marker). Both appear on the Space row of the menu, each drawn as a small glowing silhouette that flies nose-first along its orbit. Find ISS swings the camera over the station, and ?sat=iss or ?sat=tiangong links straight to one.
Orbits and tracks — two views of the same path
The Space row has two separate switches, because there are two honest ways to draw where a station goes:
- Orbits — the station's path through space: a ring around the whole globe, one full lap, about 92 minutes for the ISS. The ring is tilted to the equator by the orbit's inclination (51.6° for the ISS, 41.5° for Tiangong) and, crucially, it does not turn with Earth. It stays fixed against the stars while the planet spins underneath it.
- Tracks — the path over the ground: the line traced by the point directly below the station. It's drawn half an orbit behind (faint) and one and a half orbits ahead, and it is glued to the surface like the coastlines.
The difference between the two is Earth's rotation. In the 92 minutes the ISS takes to go once around the ring, Earth turns about 23°, so when the station comes back round a different stretch of ground is waiting under it. That's why the ground track isn't a closed loop: it's a wave that slides about 23° west on every pass, and why over a day or so the station passes over almost everywhere between 51.6° N and 51.6° S. The wave peaks at ±51.6° because a station can never pass directly over a latitude higher than its orbit's inclination.
The easiest way to see it: turn on both Orbits and Tracks and time-warp at a few hundred times real speed. The ring holds still in space; the globe and the track turn together beneath it. Above about 5 000× warp a station laps Earth every second or so of screen time and the markers and tracks turn to noise, so they hide and only the orbit ring stays.
Sixteen sunrises a day
The stations dim while they're in Earth's shadow. At this height a station spends up to about 40% of every orbit in the dark, so the crew see about sixteen sunrises and sixteen sunsets a day — one of each every 92 minutes. Click a station for its card: position, altitude, speed, whether it's in sunlight, a countdown to the next orbital sunrise or sunset, and who's aboard — click the count for the crew list, with links to the official station sites and each space agency's astronaut pages. Tabs along the top of the card switch between the ISS, Tiangong and the crew list.
Where the positions come from
Every few hours a small server-side service downloads the latest published orbital elements — a compact description of each orbit at a given moment — and the browser calculates the position from them with the standard SGP4 orbit model, driven by the same simulated clock as the sun and moon. The ISS lands within about 0.1° of independent live trackers. Elements drift out of date as the orbit decays and the station fires its engines, so the markers hide if you warp more than two weeks from the date they were published. The crew list is kept by hand and updated at each crew rotation.
Source: CelesTrak GP orbital elements · celestrak.org · propagation with satellite.js
The solar-eclipse renderer
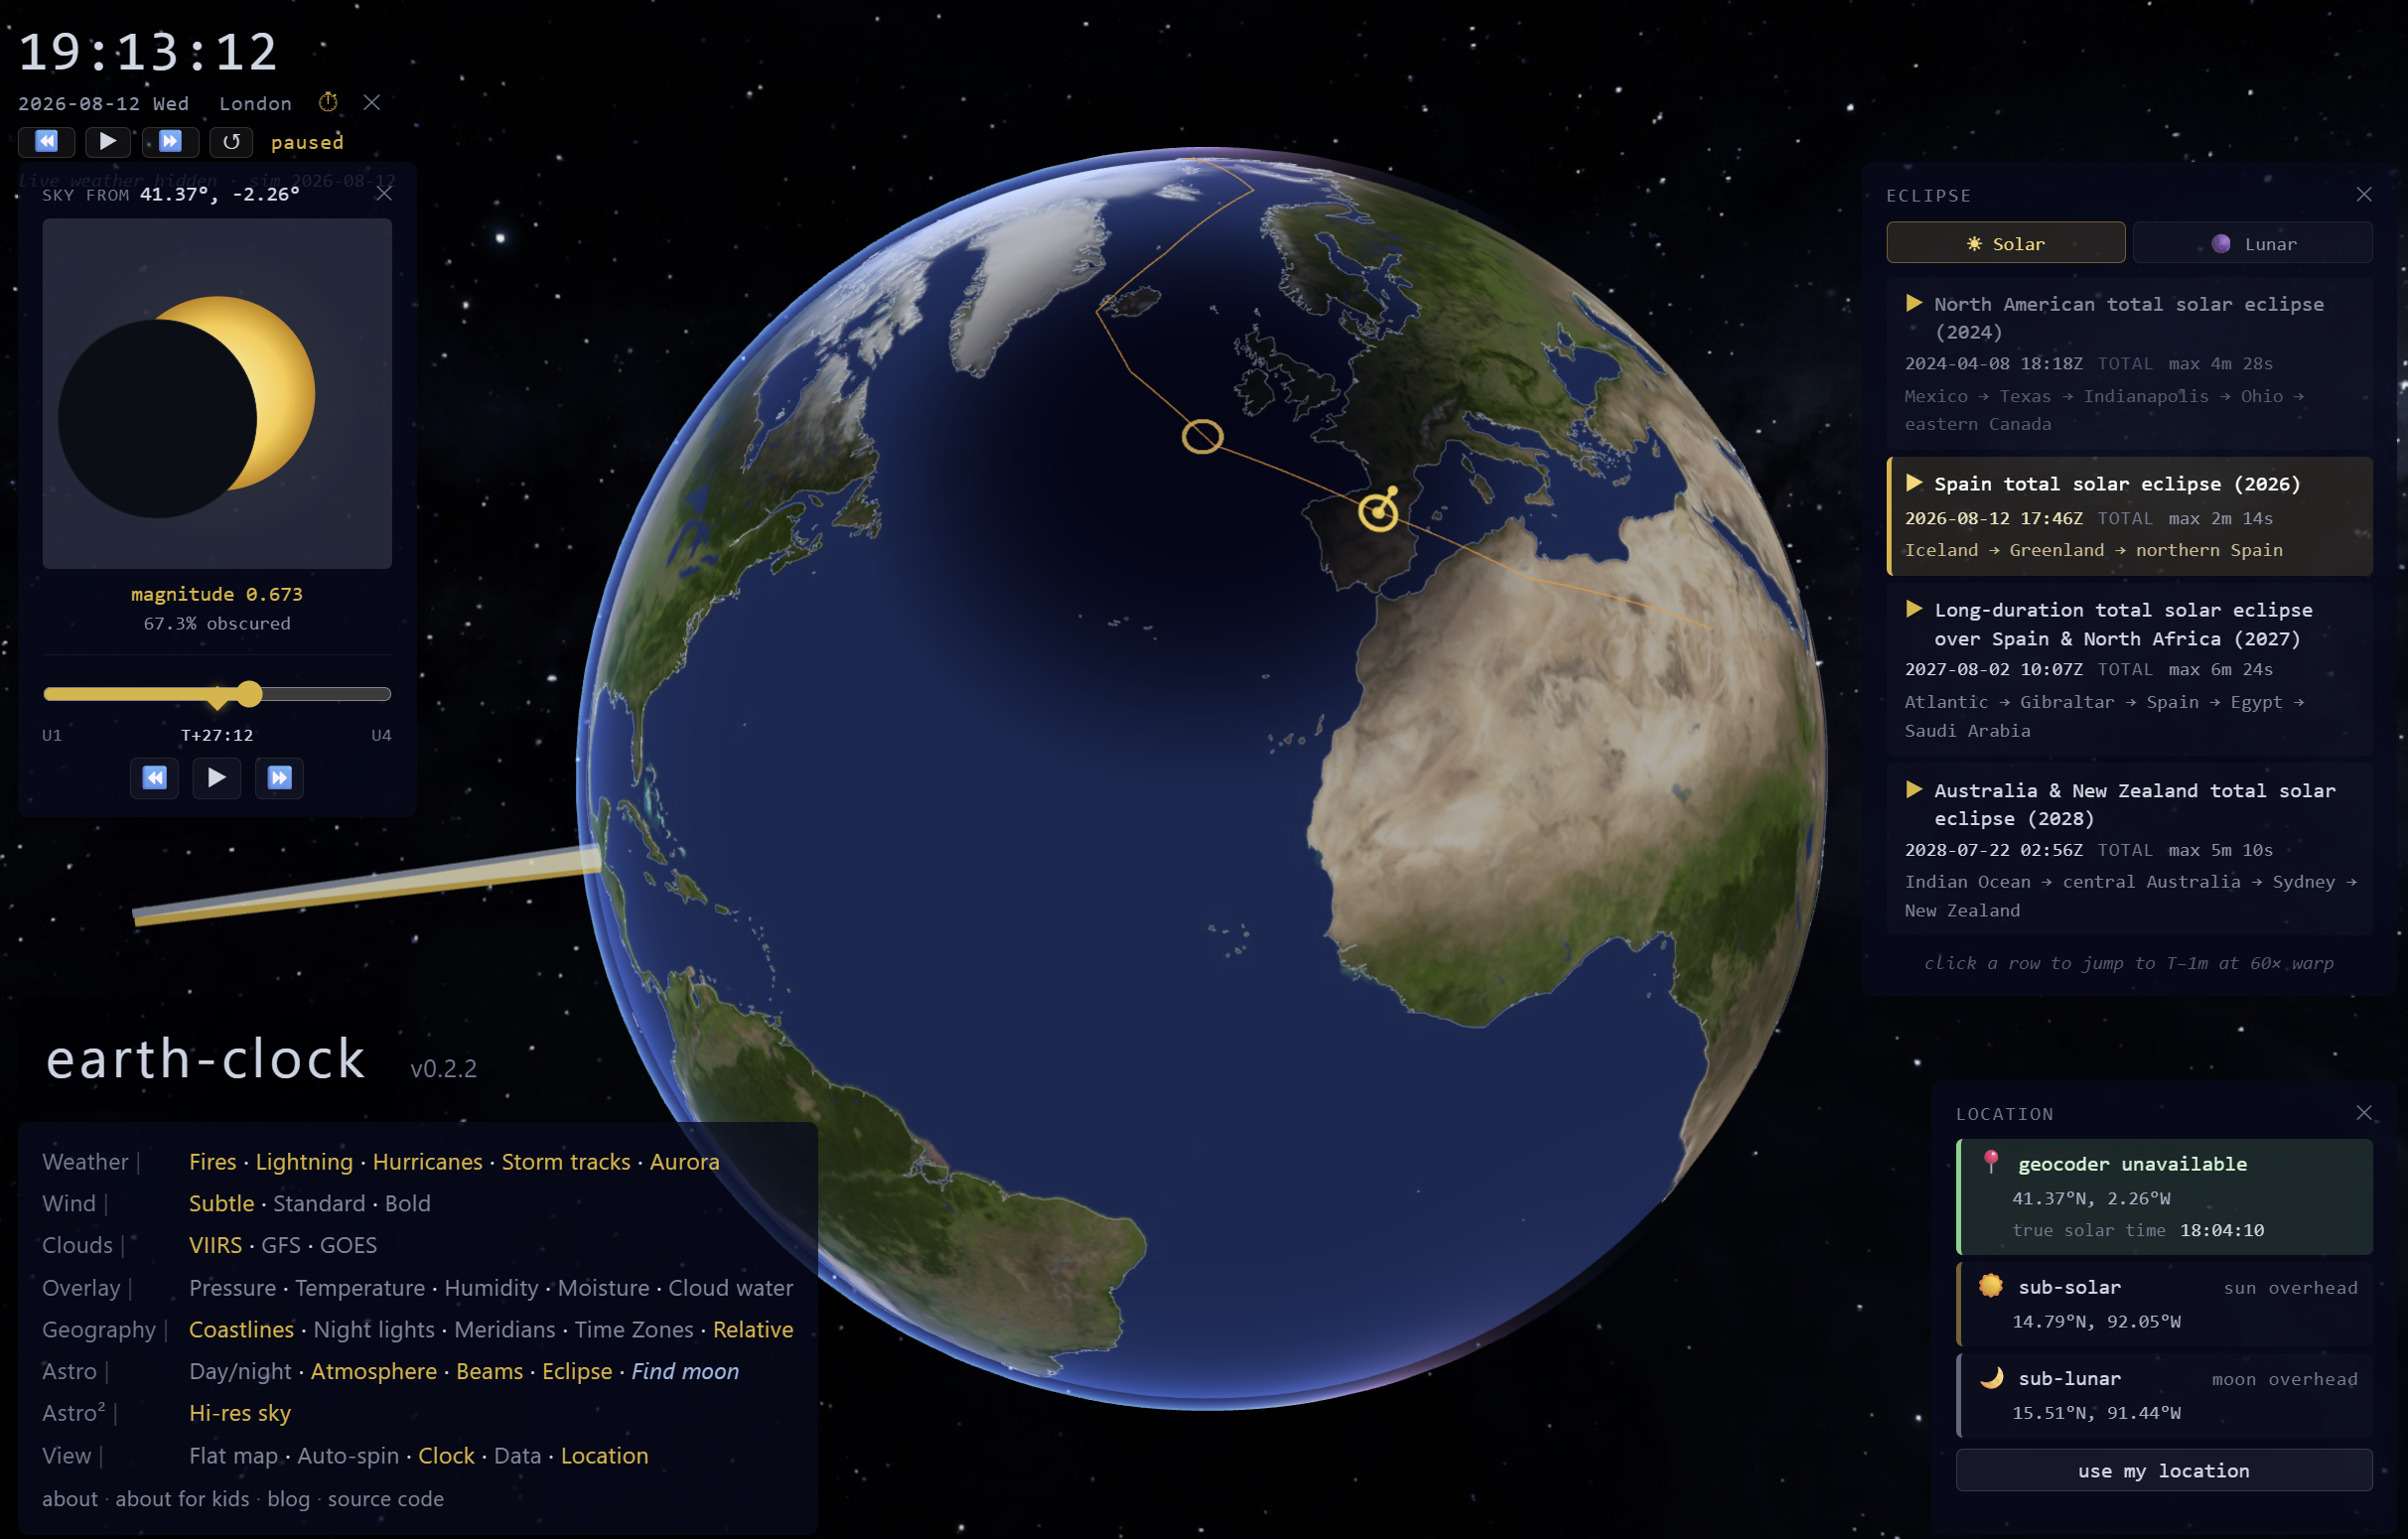
Toggle "Eclipse" in the menu's Astro row to open the in-app Eclipse panel — it lists every catalogued event in chronological order. Click any row to jump simulated time to T-minus-one-minute of that event, dial time-warp to 60×, and select that eclipse's path. While simulated time sits within 24 h of the loaded event's window, three things appear on the globe: a smooth orange path of totality, a dark umbra disc sliding along it, and a thin diamond-ring outlining the boundary between full totality and partial eclipse.
Why the headline events use NASA's data
Eclipse geometry is brutally sensitive. The moon's umbra is ~290 km wide where it falls on Earth — a thin pencil dragged across the planet over four hours. Even a few arc-minutes of lunar-position error displaces the shadow tens of kilometres on the surface, and earlier versions of this site (using a simpler lunar model) couldn't render the 2026 Spain eclipse on the right continent.
The current Meeus-based lunar model is accurate to about ten arc-seconds, which keeps the runtime-computed shadow well inside the real umbra envelope, so any eclipse — historical or future — now renders correctly at runtime from first principles. For the four catalogued headline events (2024-04-08 North America, 2026-08-12 Spain, 2027-08-02 Egypt, 2028-07-22 Australia & New Zealand) we additionally use NASA Goddard's published centerline coordinates directly. These are arrays of (time, lat, lon, magnitude) waypoints from Fred Espenak and Jean Meeus's predictions, interpolated at runtime — accurate to the last published decimal place and deterministic across future code changes.
The umbra, the penumbra, and the diamond ring
The dark disc rendered at the umbra centre is sized to match the real path width (~290 km, ~1.3° of angular radius from Earth's centre). Around it is a wider but softer penumbra — the region where observers see a partial eclipse, only some of the sun blocked. A thin warm-gold ring is drawn at the umbra/penumbra boundary, named for the photographic diamond ring effect: the instant just before or after totality when one bright bead of sunlight breaks past the lunar limb.
The shadow is rendered as a single transparent spherical shell at radius 1.001 R⊕, with a fragment shader computing per-pixel angular distance from the umbra centre and assigning umbra/ring/penumbra dimming accordingly. Cheaper than three separate meshes and self-consistent under camera motion.
How to drive it
Toggle Astro → Eclipse in the menu to open the Eclipse panel (top-left, under the clock). Click any event row to snap the simulated clock to T-minus-one-minute and start a 60× time-warp. The whole four-hour event plays out in about four minutes. Pause, slow, or reverse via the time-control row that appears next to the clock; closing the Eclipse panel snaps simulated time back to wall-clock now.
Sharing an eclipse: add ?eclipse= and the event's date as YYYYMMDD to the address — e.g. earth-clock.onemonkey.org/?eclipse=20270802 for the 2027 eclipse over Spain & North Africa. The link opens straight into that event, solar or lunar, with the clock already running.
Why this exists
A solar eclipse, watched live, can be among the most affecting experiences of a human life. People travel across the world for one. But the eclipse is only the most concentrated version of something always available — the planet you live on rotates, orbits, tilts, weathers, burns, freezes, and rains, every day. Most of us look up and see none of it.
earth-clock is an attempt to make the everyday version of that experience continuously accessible. A clock you can look at and see, in one glance, where you are on the only planet we have — what time it is in the sense that matters: where the sun is, what the weather is doing, which storms are spinning up, where the fires are burning, where the auroras are this hour, when the moon's shadow will pass over us again.
The design philosophy is articulated in a longer essay at onemonkey.org.
Lineage
earth-clock stands on the shoulders of several earlier projects, all of which deserve naming.
cambecc/air — Tokyo Wind Map (2013)
Cameron Beccario's original demonstration that animated wind particles, drawn over a map, could communicate the structure of the atmosphere more clearly than any static chart. Showed a single city's wind in real time.
cambecc/earth — earth.nullschool.net (2014–)
The global generalisation of the Tokyo Wind Map. For more than a decade earth.nullschool.net has been the reference for what a beautiful, accurate, public-domain-data-driven Earth visualisation looks like. cambecc/earth is a sophisticated D3.js + HTML5 canvas renderer that supports eight different cartographic projections — orthographic globe, equirectangular, azimuthal equidistant, conic equidistant, stereographic, Waterman butterfly, Winkel tripel, and Atlantis — and warps the wind-particle paths correctly through each. The same codebase, with a day/night terminator and a clock added, is what runs in earth-clock's classic archive at /classic/. We retain the original copyright and MIT licence.
earth-clock classic (2024–)
A fork of cambecc/earth by Caspar Addyman, adding a real-time day/night terminator overlay and a clock readout — making the visualisation literally a clock told by the planet's orientation, rather than only a weather map. Preserved at /classic/.
The WebGL rebuild — the current experience (2026)
A ground-up rebuild for 2026 in TypeScript and Three.js. The canvas-and-D3 wind particles became GPU-accelerated particles drifting on a real tilted sphere; the day-night overlay became shader-based lighting from a true-position sun; the moon got placed at its real distance; the weather feeds expanded to clouds, fires, hurricanes, lightning, aurora; and a NASA-data-driven eclipse renderer was added as the headline feature targeting the August 2026 total solar eclipse over Spain.
Currently offers two view modes: the 3D globe (default) and an equirectangular flat map. The other six classic projections (azimuthal equidistant, conic equidistant, stereographic, Waterman butterfly, Winkel tripel, Atlantis) are on the roadmap.
Same project, same purpose, twelve more years of accumulated atmospheric data and a decade of WebGL maturity to draw on.
How it's built
localStorage.
The current 3D experience is a TypeScript SPA built with Vite, rendering to WebGL2 via Three.js. No backend per page load; all data is fetched from public endpoints client-side. The one exception is the GFS weather pipeline (weather-service.js at the repo root), which runs a small Node service on the server every 6 hours to download GRIB2 from NOAA NOMADS, decode it with a pure-JS GRIB2 parser, and write JSON files that the frontend reads.
Wind particles are simulated on the GPU using a GPUComputationRenderer ping-pong with two 256×256 RGBA float textures (one for positions, one for ages). 65 536 particles total; each step samples the current wind vector field, advects, and re-emits on a probabilistic basis. Streak trails are accumulated into a separate offscreen render target with an additive blend + slow exponential fade, then composited as a screen-space quad behind the planet.
Atmosphere, clouds, eclipse shadow, and beams are all custom GLSL fragment shaders on transparent concentric spherical shells around Earth, with explicit renderOrder to keep the alpha-sort deterministic.
Source: github.com/infantlab/earth-clock (MIT). The live development plan is at PLAN.md; the full per-layer history is archived at frontend/docs/PLAN-archive.md.
Credits
Anything you can see, animate, or measure on this site exists because of the patient, accurate, mostly-public work of dozens of people, organisations, and government agencies. The full machine-readable list lives in CREDITS.md. Highlights:
- Cameron Beccario — the original
earthcodebase and design language that earth-clock descends from. - NASA — VIIRS imagery (GIBS), FIRMS fire detections, eclipse predictions (Goddard / Espenak / Meeus), public-domain texture derivatives.
- NOAA — GFS weather model (NOMADS), tropical cyclones (NHC), space weather and aurora (SWPC).
- USGS — Earthquake Hazards Program real-time feed.
- Smithsonian Institution — Global Volcanism Program, Volcanoes of the World database.
- Peter Bird — PB2002 digital plate-boundary model, mirrored as GeoJSON by fraxen/tectonicplates.
- CelesTrak (T.S. Kelso) — public orbital elements for the space stations; satellite.js — the SGP4 propagator that turns them into positions.
- Blitzortung — community-volunteer-operated VLF lightning detection network.
- Solar System Scope (INOVE s.r.o.) — Earth, moon, and starmap textures, CC-BY 4.0.
- Natural Earth — public-domain coastline TopoJSON.
- OpenStreetMap contributors — Nominatim reverse-geocoding for place names.
- Jean Meeus — Astronomical Algorithms (2nd ed., 1998). Chapter 47's truncated ELP-2000-82B series drives the moon's geocentric position — accurate to about ten arcseconds, comfortably smaller than the sun's apparent disc so eclipse geometry works correctly anywhere on Earth.
- USNO and NOAA SPA — the underlying GMST and solar-position formulae.
- Paul Schlyter — the simplified planetary-position algorithms that drove the lunar calculation through v0.1.5; retained credit because that work carried the project for over a year of development and the page is still one of the best plain-text astronomy resources on the web.
- Three.js, Vite, TypeScript, fflate — the underlying engineering tools, all MIT or Apache-2.0.
The data shown is in the public domain unless otherwise noted (Solar System Scope textures and the Blitzortung lightning stream are licensed under CC-BY 4.0 and a community-use grant respectively; OpenStreetMap data is ODbL). The earth-clock source code itself is MIT-licensed.
Built by Caspar Addyman as a fork of Cameron Beccario's earth. Bug reports, ideas, and pull requests welcome at the issues page.
Feedback & contact
earth-clock is made by Caspar Addyman. If you have a bug report, a feature idea, or just want to say hello, you're welcome to get in touch directly:
For code contributions and detailed bug reports, the GitHub issues page is the best place — it makes it easy to attach screenshots and track progress.